Hypertension App Performance Dashboard
Mar 2021 ~ OMRON Healthcare
Length: 1mo (at 1.0 FTE)
Software: Amazon QuickSight
Programming language: SQL
Data: Hypertension Plus application database containing details about the app users,
their blood pressure measurements, and medication plan history
Problem description:
Design an Amazon QuickSight dashboard to track the performance of a blood pressure monitoring app
Approach & Results:
After discussing with several stakeholders to determine the performance indicators
needed, the data was processed. This phase included querying using SQL, joining
multiple tables, mapping variable codes to names (e.g. 1 to male and 2 to female), and
creating calculated fields, such as the age of the users based on their date of birth
or the duration between their first and last blood pressure measurements. Finally,
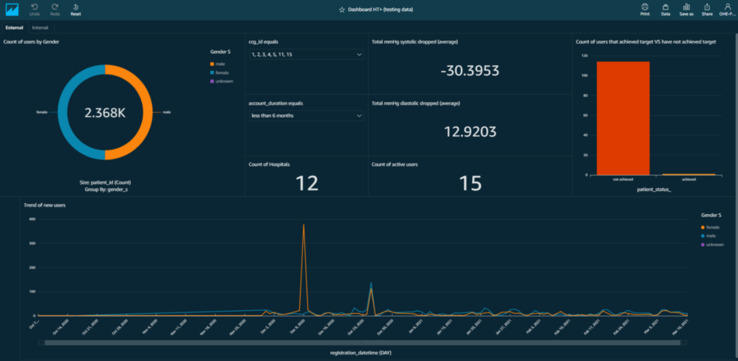
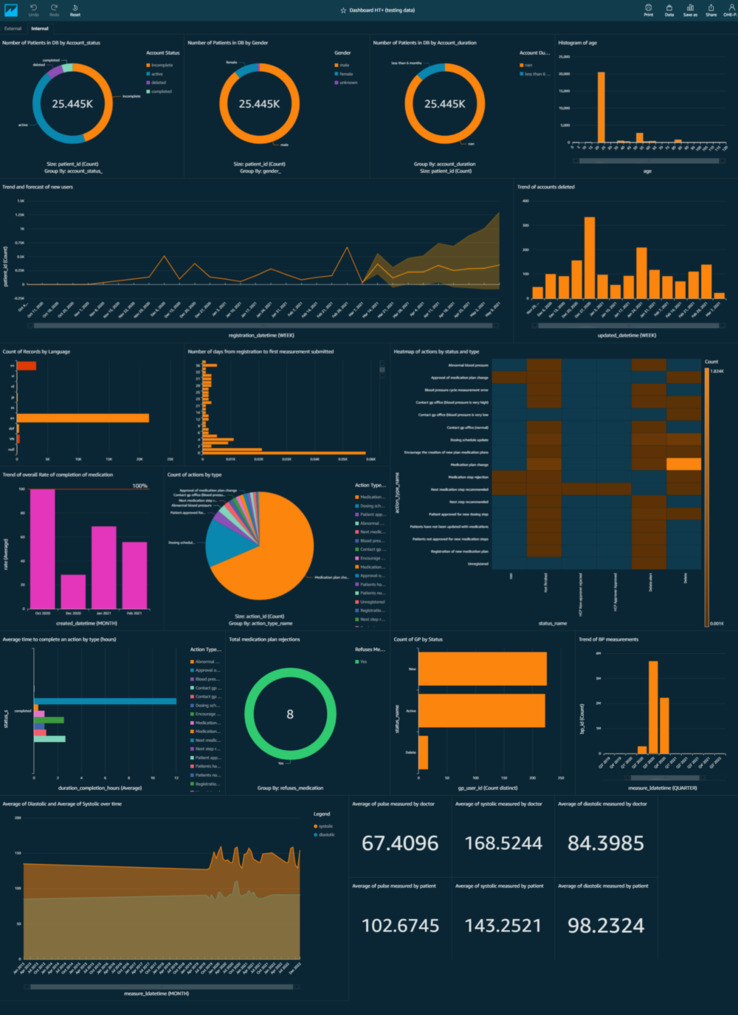
the charts were designed and displayed in two sheets based on their intended audience (internal and
external), reaching a 100% usage rate among stakeholders at the time of my departure.
DISCLAIMER: For data privacy compliance, the screenshots
below use randomly generated data rather than real user data. Hence, the insights shown should
NOT be interpreted as accurate. The images are meant only to illustrate the visualization
types and their potential for driving actionable insights.